Tweeting The Impact: The Top 10 Nonprofit X (Twitter) Accounts And Their Stats
Welcome back to our exploration of social media dynamics among nonprofit organisations. In our previous blog, we delved into the network of professionals, LinkedIn.
Now, we turn our lens to X, the platform formerly known as Twitter. Its fast-paced, concise format demands a different approach for nonprofits compared to other social media platforms.
As we embark on this journey, we'll dissect how nonprofits utilise X – from their follower counts and funding correlations to their content strategies and engagement metrics.

Followers: Who's Leading the Charge on X?

On average, the top 10 nonprofits on X command an impressive 8.3 million followers each. Let's take a quick look at these nonprofit organisations.
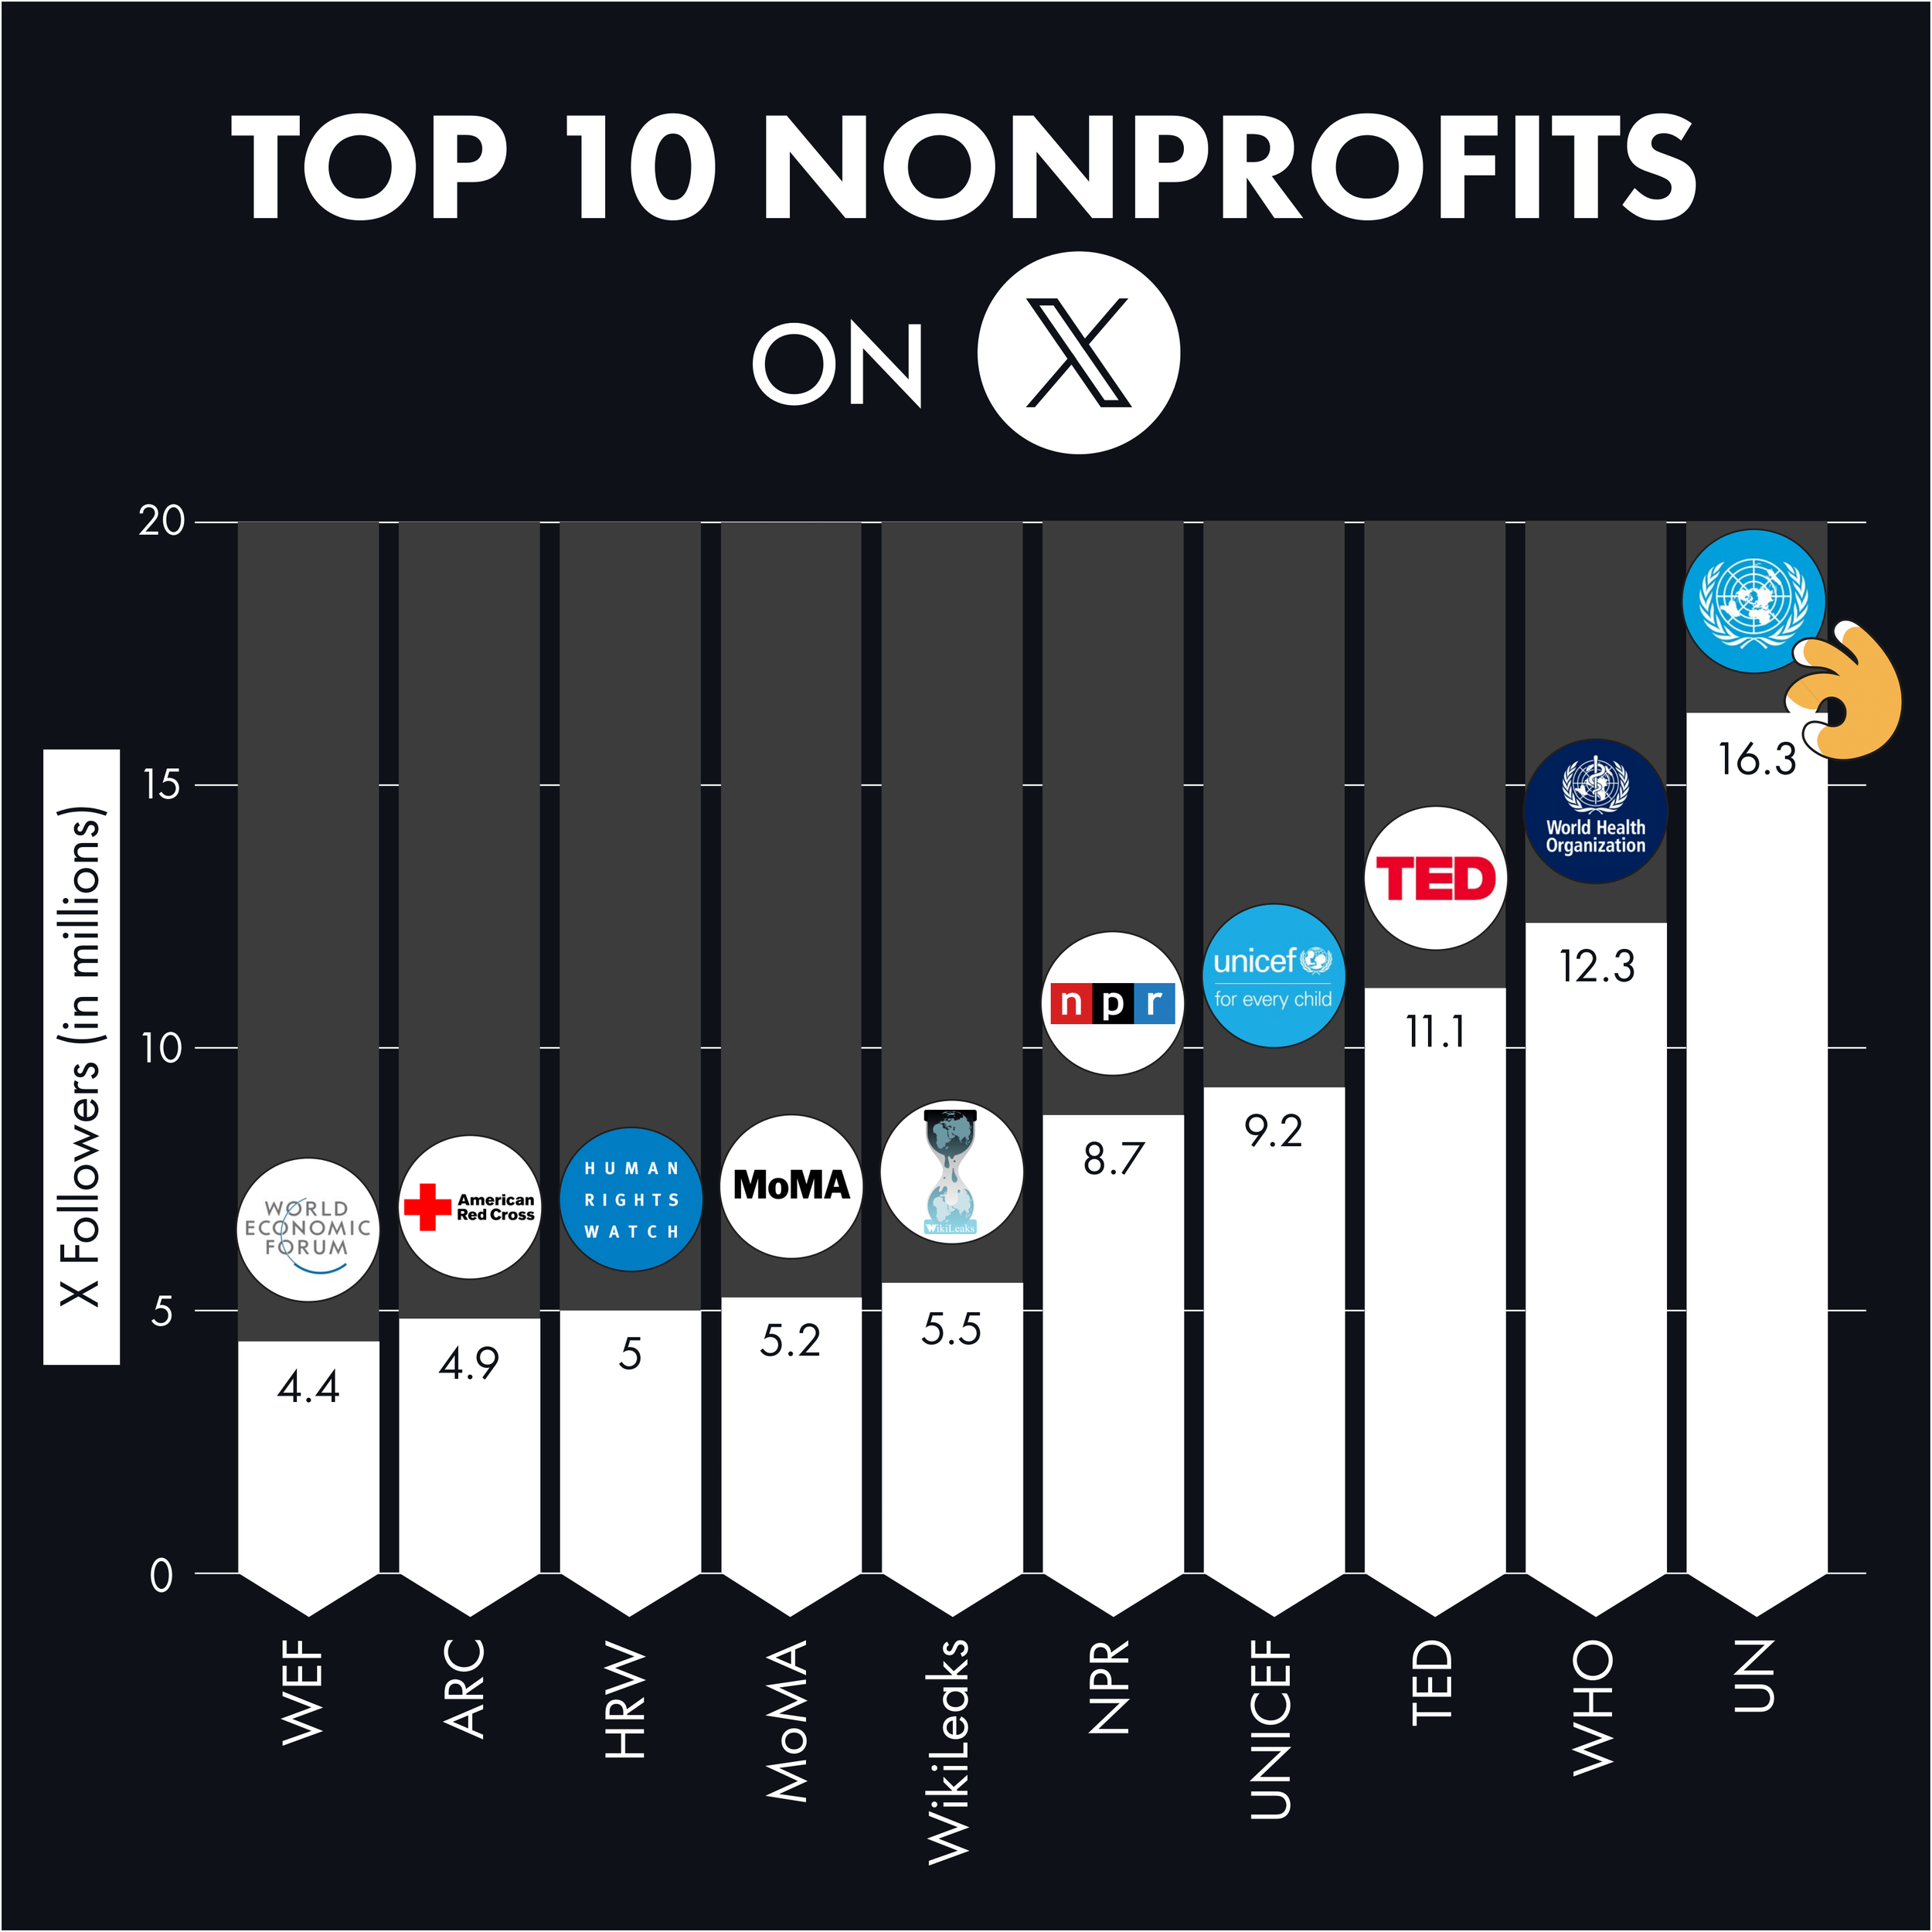
The United Nations (UN) is leading the charge with a remarkable 16.3 million followers, demonstrating its international diplomacy and humanitarian efforts.
Close on its heels is the World Health Organization (WHO) with 12.3 million followers, underlining its crucial role in global health.
TED, a hub for inspiring ideas, commands a notable following of 11.1 million. The United Nations Children's Fund (UNICEF) and National Public Radio (NPR) are not far behind, with 9.2 and 8.7 million followers respectively.
WikiLeaks stands out with its controversial investigative approach, attracting 5.5 million followers. The Museum of Modern Art (MoMA), representing the art world, follows with 5.2 million.
Human Rights Watch and the American Red Cross, both focusing on humanitarian issues, have around 5 million followers each.
Concluding the top ten is the World Economic Forum (WEF) with 4.4 million followers, emphasising its influence in economic discourse.

On average, our top 10 nonprofits have a budget of about $3.2 billion. But what does this imply about their online influence?

At the top of the funding spectrum is the United Nations Children's Fund (UNICEF), with a budget of $10.3 billion.
We also see organisations like TED, the American Red Cross, and the World Economic Forum, with budgets of $2.9 billion, $3.2 billion, and $0.46 billion respectively.
Interestingly, finding accurate financial data for WikiLeaks was difficult, as their financial information isn't always clear or accessible.
In the realm of X (and other social media platforms), is funding a direct indicator of digital success, or are there other factors at play that define an organisation's online impact?

From our analysis, we estimate that, on average, these accounts use:
Pictures: 44%
Links: 35%
Videos: 14%
Text-Based Content: 7%

Leading in nonprofit video content is TED (Technology, Entertainment, Design), utilising it 50% of the time, aligning with their focus on impactful storytelling. We discussed more about TED in our Top 10 Nonprofit Linkedin blog.
In contrast, the United Nations (UN) and the World Health Organization (WHO) posts nonprofit videos 25% and 6% of the time, respectively, balancing their content with other formats.
When it comes to links, National Public Radio (NPR) heavily relies on them, with 92% of their posts containing links, likely directing followers to detailed articles and broadcasts. I
It's important to note that NPR has boycotted X, pausing their activity on the platform in protest at Elon Musk’s takeover. However, they’re still one of the top 5 nonprofits on X in terms of followers despite not posting since April 2023.
The World Economic Forum (WEF) also emphasises links with 68% of their content, guiding their audience to more in-depth economic not possible with X’s character count limit.
Pictures are predominantly used by the American Red Cross, in 90% of their posts.
The Museum of Modern Art (MoMA) and the United Nations Children's Fund (UNICEF) also leverage pictures heavily, at 55% and 19%, respectively.
Text-only posts are least common, with the UN and WHO using them in 5% and 22% of their posts.

Engagement Metrics: Like It or Not, Let's Comment on the Impressions and Retweets

In examining the engagement metrics of the top 10 nonprofits on X, we uncover some unexpected trends: from TED's striking success with fewer posts to the WHO's impressive audience interactions.
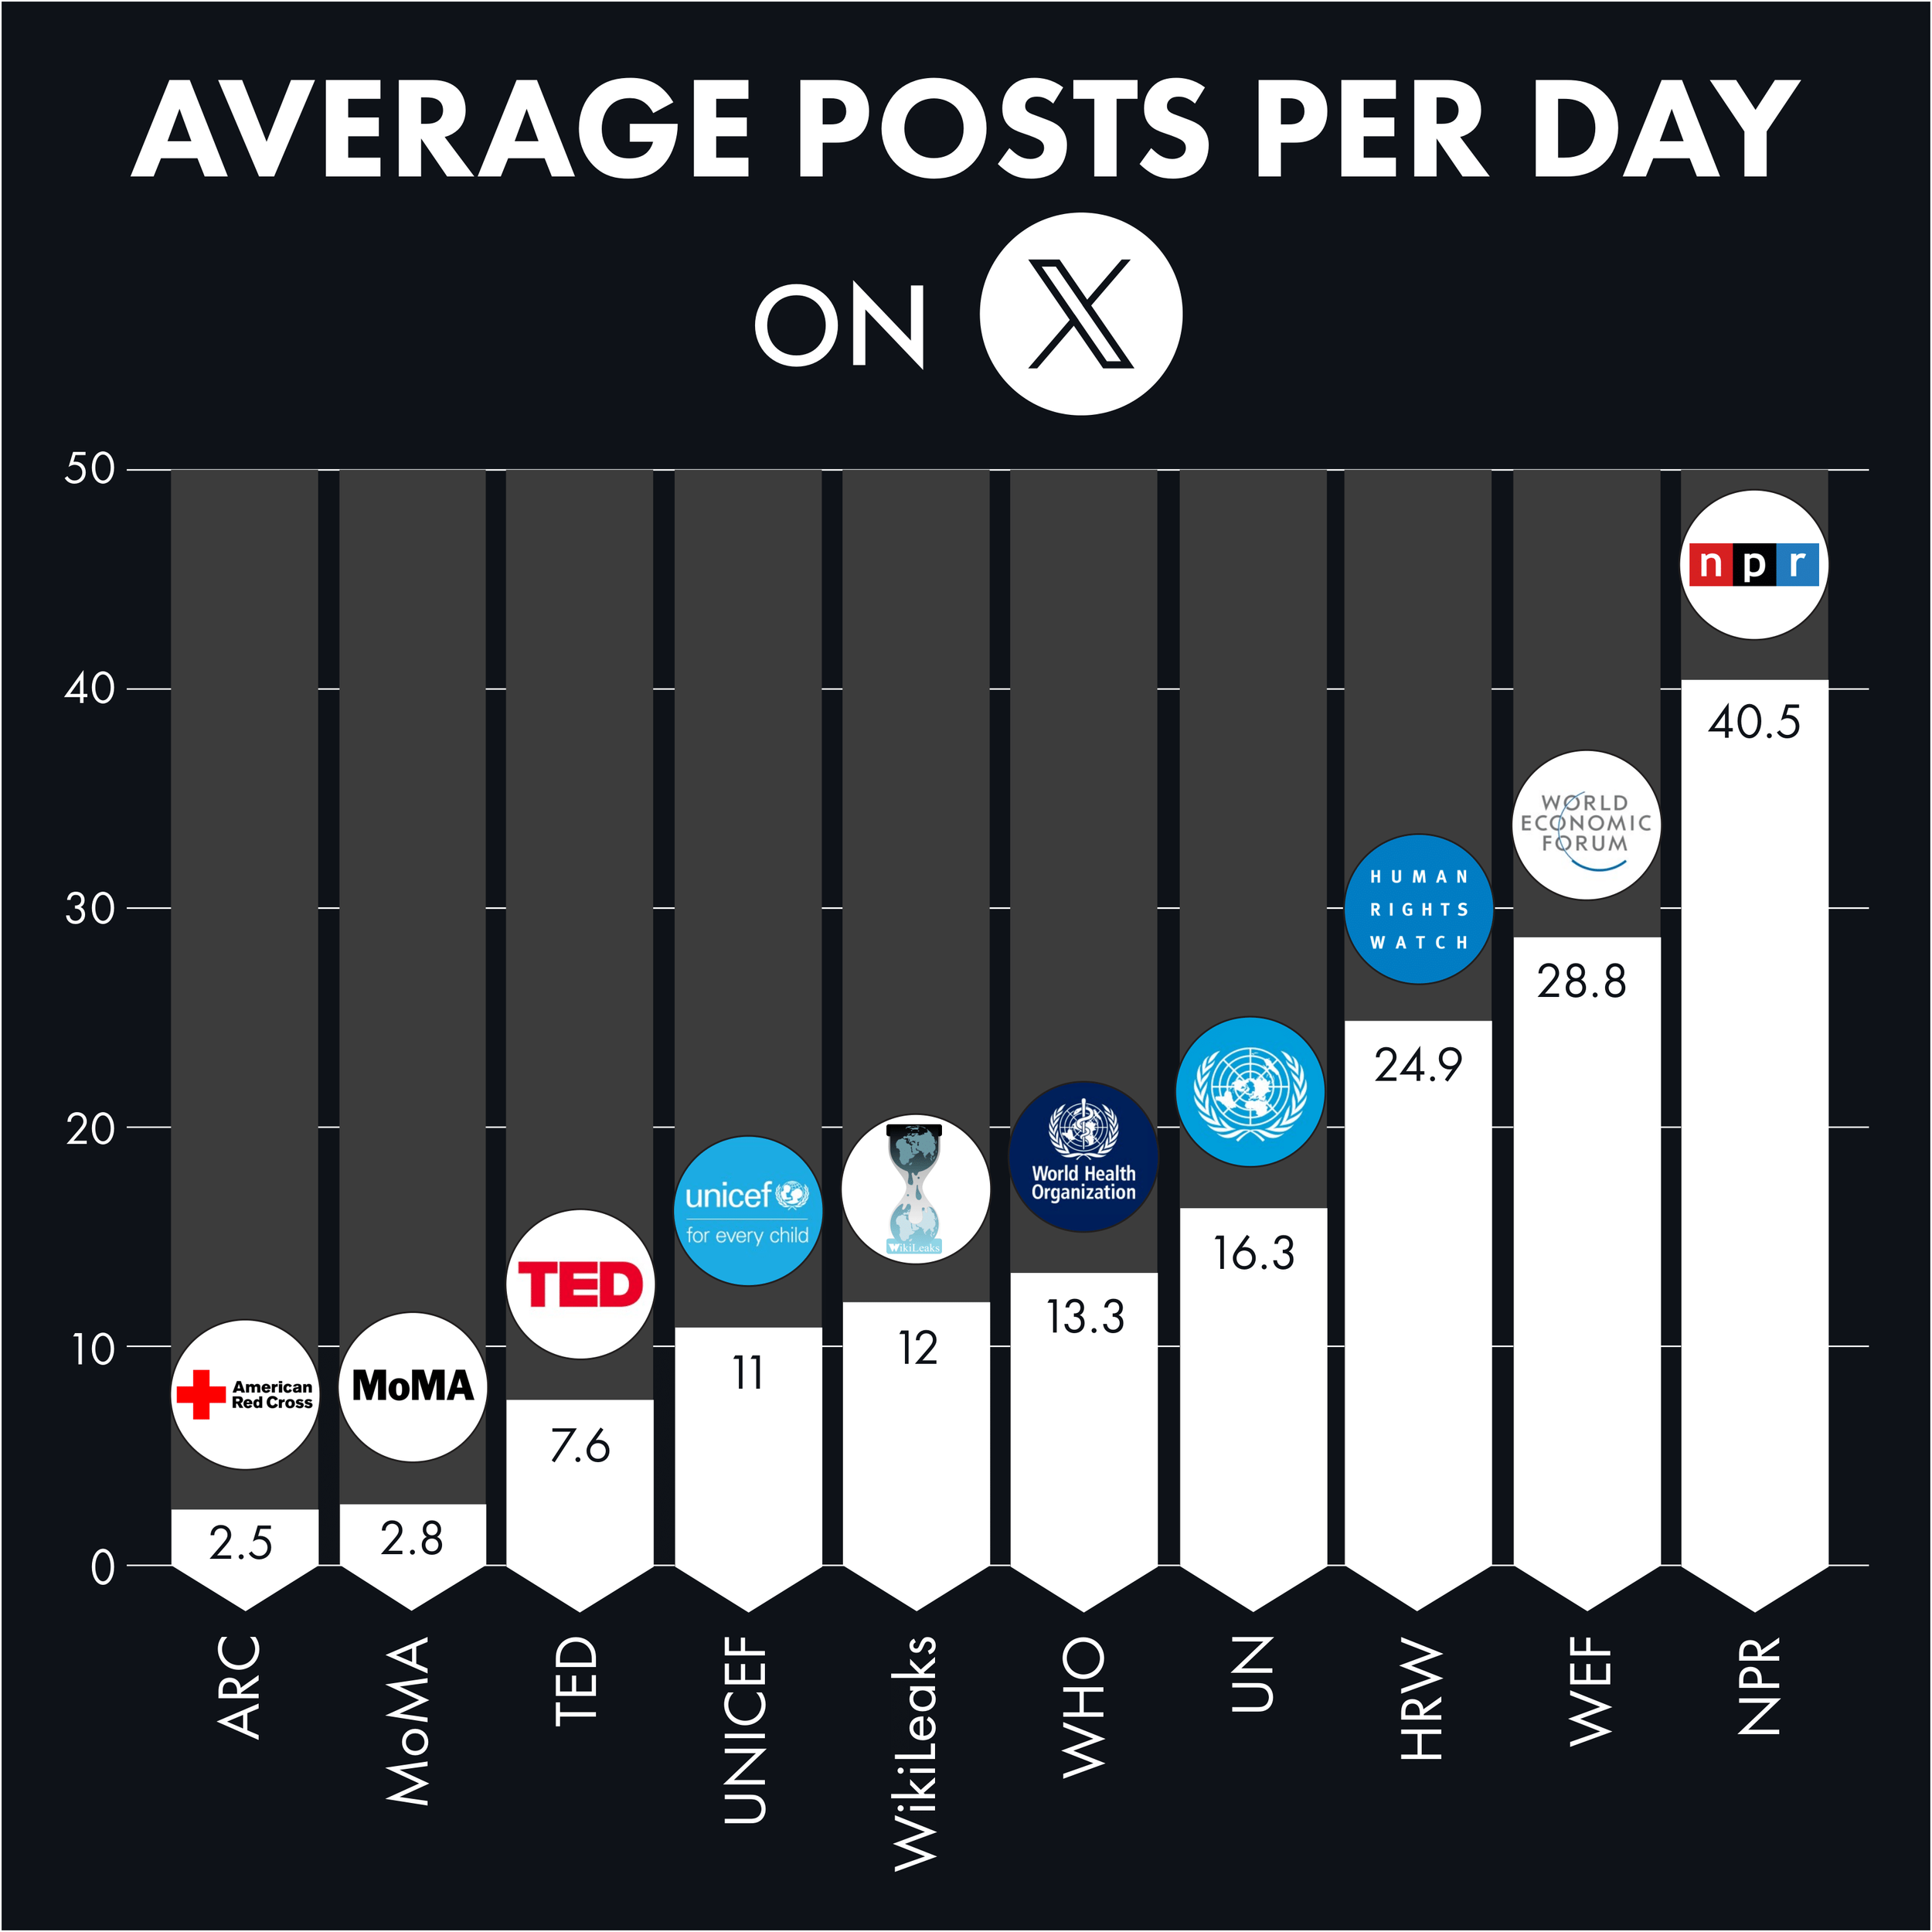
On average, these organisations post about 16 times per day.
National Public Radio (NPR), despite ceasing their activity in protest against Elon Musk's leadership, led with an average of 40 posts per day in their last active period (April 1-8, 2023).
Human Rights Watch and the World Economic Forum (WEF) follow with 25 and 29 posts per day, respectively.
Interestingly, WEF on LinkedIn, tops the chart with a remarkable 39 posts per day, while on Instagram, it maintains a strong presence with 2 posts per day, the second-highest among the top 10 nonprofits.
On the lower end, the Museum of Modern Art (MoMA) and the American Red Cross post relatively less frequently, averaging around 3 and 2 posts per day.

In terms of likes, these posts on average garner around 1055 likes per post.
World Health Organization (WHO): Leads with an average of 3,850 likes.
United Nations (UN): Receives about 2,350 likes per post.
World Economic Forum (WEF): Averages only 20 likes per post.

In terms of audience interaction, each post garners around 147 comments.
The United Nations leads in engaging its audience, with an average of 537 comments per post, followed by WHO with 261. The WEF, at the lower end, averages 3 comments per post.

The average number of retweets per post stands at about 520.
WHO stands out with an average of 1970 retweets per post, which indicates their content's wide reach and shareability.
TED, with its diverse range of engaging talks, averages 58 retweets per post. While this may seem lower compared to other nonprofits, it could indicate that TED's audience prefers to engage with content in ways other than retweeting, such as through likes or comments

Lastly, the average views per post is nearly 250,200. It's worth noting that 'views per post' or 'impressions' is a metric relatively new to the public on X.
World Health Organization (WHO): Leads with 1,043,890 views
United Nations (UN): Follows with 442,220 views per post.
TED: Attracts 275,550 views per post.
World Economic Forum (WEF): A lower average of around 24,400 views.
Museum of Modern Art (MoMA): 28,140 views per post.

Conclusion: Pondering the Digital Dynamics of Nonprofits on X
In reviewing the presence of top nonprofits on X, we're left with a few observations and questions.
The heavy use of visuals prompts a question: do they lead to more meaningful engagement with the audience compared to other content types?
How does WHO's leading engagement reflect broader audience interests, and what can we learn from WEF's lower engagement rates?
Are these indicators of content resonance or distinct audience interaction styles?
Furthermore, this journey uncovers a nuanced truth: success in the digital realm is not solely dictated by funding or follower counts.
It prompts us to ask, what truly drives social media success for nonprofits? Is it the synergy of mission-aligned content, message resonance, or a blend of various strategies?
As we conclude this exploration, the broader narrative of nonprofits on X is far from complete. Your observations and experiences can shed more light on this complex subject.
We're keen to hear your thoughts and observations. What trends have you noticed in the nonprofit sector on social media? Are there new areas we should explore? Your insights and experiences are invaluable to this ongoing conversation, helping us all better understand the nuanced impact of nonprofits on platforms like X.
